How to Determine if a Stock is A Buy
First, we have this article:
https://dailyreckoning.com/thanks-yellen-heres-yesterdays-rate-hike/
IS FDD A BUY? We will Find out.
I immediately open a WEEKLY chart and identify if there is SELLING or ACTIVE BUYING, which is of course my primary intent: ACTIVE BUYING.
This is what I found:
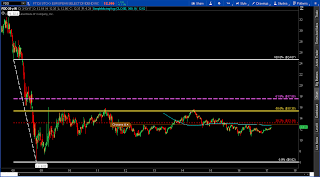
We have a range drawn from a low to a low (price values) where we have a short under way.
HOW CAN WE TELL?
First we add a FIB drawing tool to our platforms and we begin our drawing FROM A HIGH to a low, and in this case: 24.67 drawn down to 6.02. THE YELLOW LINE across the body of this range is at 15.35 and price has not been able to remain above this line since 2009! Sellers are pouring in each time that price is crossed.
Observing further, 17.55 is our key crossing point and if price cannot move above AND REMAIN above this price level, I will not remain a long or a buyer if price pulls back.
Simply put, this ETF is not a buy yet. BUT, in my next installment, I will show you WHERE I WOULD BUY in the lower portions of this range, below 14 dollars.
Dave Johnson, Your Pro Trader
Comments
Post a Comment
Please feel free to add comments, post questions and your own charts.